Using the charts
There are several charts within to help you monitor and optimize your Snowflake instance. Here are some common tools you can use across all the charts.
Filtering
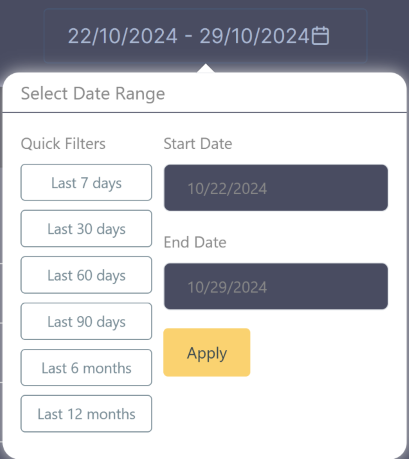
Each page provides filtering capabilities that allow you to:
- Customize the data shown in charts and tables
- Narrow down specific time periods
- Focus on particular metrics or dimensions
Grain
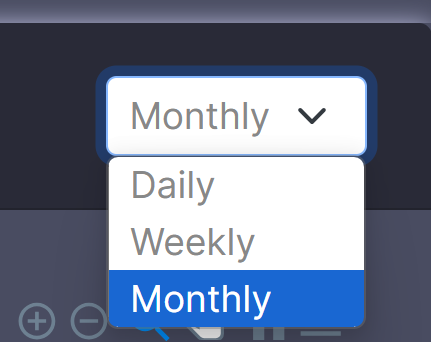
Within each chart, you can adjust the data granularity to:
- Daily
- Weekly
- Monthly
When viewing data at different granularity levels, the chart will automatically aggregate your data accordingly.
If you have applied filters to a large dataset, the charts may take a few moments to render as they process the data aggregation.
Interactive Features
Using Tooltips
When hovering over any chart, a tooltip will appear showing detailed information:
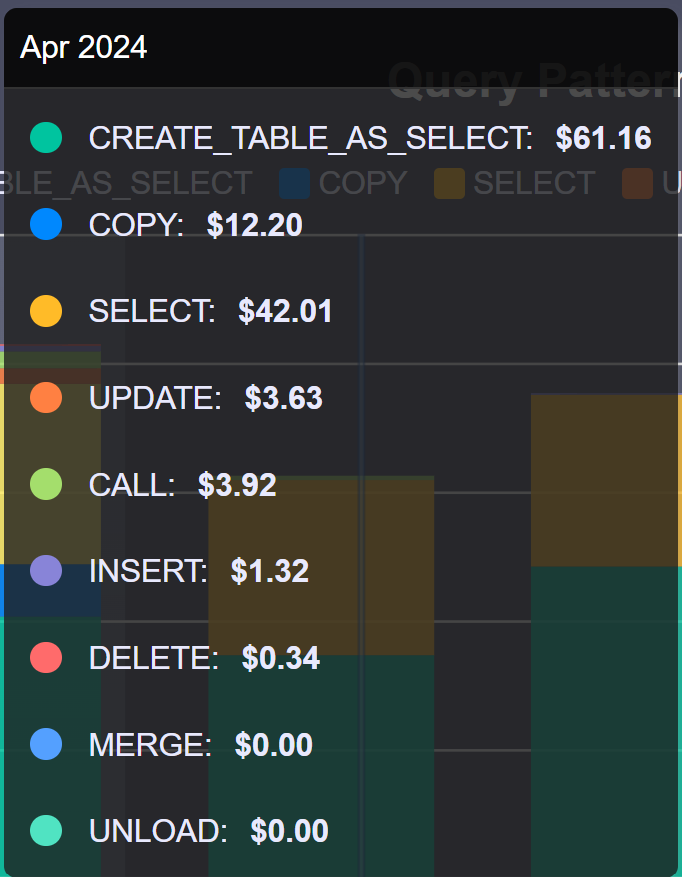
The tooltip provides:
- Breakdown of costs for that specific point
- Percentage of total for each category
- Date and time period details
Click and drag across the chart to zoom into a specific time period. Double-click to reset the view.
Understanding Common Metrics
Standard Table Columns
Across different charts, you'll find these common columns in the tables:
| Column | Description | Example |
|---|---|---|
| Total Spend | Total cost for the selected period | $1,000 |
| Value Change | Absolute cost difference from previous period | +$200 |
| % Change | Percentage difference from previous period | +20% |
| Annualized Amount | Projected annual cost based on current usage | $12,000 |
| % of Total | Percentage of overall costs | 15% |
Understanding These Metrics
Value Change and % Change
- A positive value (e.g., +$200) means costs have increased
- A negative value (e.g., -$200) means costs have decreased
- The percentage helps you understand if this is a significant change
Annualized Amount
- Shows what the yearly cost would be if current usage continues
- Helpful for budget planning and forecasting
- Remember to consider seasonal patterns in your analysis
Percentage of Total
- Shows how much of your total cost comes from this item
- Helps identify your biggest cost areas
- Useful for understanding cost distribution
- Compare costs month-to-month to spot trends
- Look for unexpected changes in percentages
- Use annualized amounts for yearly planning